[K6] Spring, Postgresql 모니터링 가이드 with gRPC
안녕하세요? 제이온입니다.
오늘은 gRPC 서버에 k6를 이용하여 부하 테스트를 진행하면서 Spring과 Postgresql의 각종 지표를 모니터링하는 과정을 소개하려고 합니다.
시각화
k6는 가상의 트래픽을 만들어서 부하 테스트를 하는 것이므로 이러한 부하 상황에 따라 우리의 애플리케이션이 어떠한 상태를 보이고 있는지 모니터링할 수 있어야 하며, 시각화를 통해 더 효과적으로 모니터링이 가능합니다.
Prometheus와 Grafana를 이용하여 스프링 애플리케이션의 메트릭을 시각화하는 방법을 작성해 보겠습니다.

Spring Boot Actuator
Spring Boot Actuator를 활성화하면, 애플리케이션을 모니터링하고 관리할 수 있는 엔드 포인트에 접속이 가능해 집니다.
# build.gradle
implementation("org.springframework.boot:spring-boot-starter-actuator")
implementation("io.micrometer:micrometer-registry-prometheus")
그리고 Actuator를 통해 모니터링되는 엔드 포인트는 Prometheus이 사용할 엔드 포인트만 열도록 하겠습니다.
# application.yml
management:
  endpoints:
    web:
      exposure:
        include: prometheus
Prometheus
Prometheus는 메트릭을 수집하고 저장하며, 이를 통해 모니터링하거나 경고할 수 있게 도와줍니다.
메트릭은 쉽게 말해서 숫자 데이터로, 요청 시간, 데이터 베이스, 활성 연결 수, CPU 사용량 등이 있습니다. 그리고 Prometheus는 이 메트릭을 HTTP를 통한 pull model 방식으로 주기적으로 수집하여 시계열 데이터로 저장합니다. 따라서, 숫자로 구성된 시계열 데이터를 수집하고 모니터링 하는 데 적합한 툴이라고 할 수 있습니다. 먼저 Prometheus 관련 설정 파일을 작성합니다. 주의할 점은 Prometheus를 도커 컨테이너로 띄우고 있고, 스프링 애플리케이션은 호스트의 것이므로 스프링 호스트를 localhost가 아니라 “host.docker.internal”로 해야 합니다. (MacOS 기준)
# prometheus.yml
global:
  scrape_interval: 15s
  evaluation_interval: 15s

scrape_configs:
  - job_name: "prometheus"
    static_configs:
      - targets: ["localhost:9090"]

  - job_name: "java_application"
    metrics_path: '/actuator/prometheus'
    scrape_interval: 5s
    static_configs:
      - targets: ["host.docker.internal:8080"]
그리고 docker-compose.yml을 작성합니다.
version: '3.7'
services:
  prometheus:
    image: prom/prometheus
    container_name: prometheus
    volumes:
      - ./prometheus.yml:/etc/prometheus/prometheus.yml
    ports:
      - "9090:9090"
    restart: always
    networks:
      - prometheus-grafana-network
networks:
  prometheus-grafana-network:
    driver: bridge
docker-compose up --build -d 이후 localhost:9090에 접속해 보면 Prometheus 대시보드가 표시됩니다.


Grafana
Grafana는 오픈 소스 데이터 시각화 및 메트릭 분석 도구입니다. Prometheus도 기본적인 시각화를 제공하지만, Grafana는 시각화에 특화된 툴이라서 Prometheus의 시계열 데이터를 더욱 효과적으로 보여 줍니다. 위에서 작성한 docker-compose.yml에 grafana 관련 설정도 추가하여 파일을 완성합니다.
위에서 작성한 docker-compose.yml에 grafana 관련 설정도 추가하여 파일을 완성합니다.
version: '3.7'
services:
  prometheus:
    image: prom/prometheus
    container_name: prometheus
    volumes:
      - ./prometheus.yml:/etc/prometheus/prometheus.yml
    ports:
      - "9090:9090"
    restart: always
    networks:
      - prometheus-grafana-network
  grafana:
    image: grafana/grafana
    container_name: grafana
    ports:
      - "3000:3000"
    restart: always
    depends_on:
      - prometheus
    privileged: true
    networks:
      - prometheus-grafana-network
networks:
  prometheus-grafana-network:
    driver: bridge
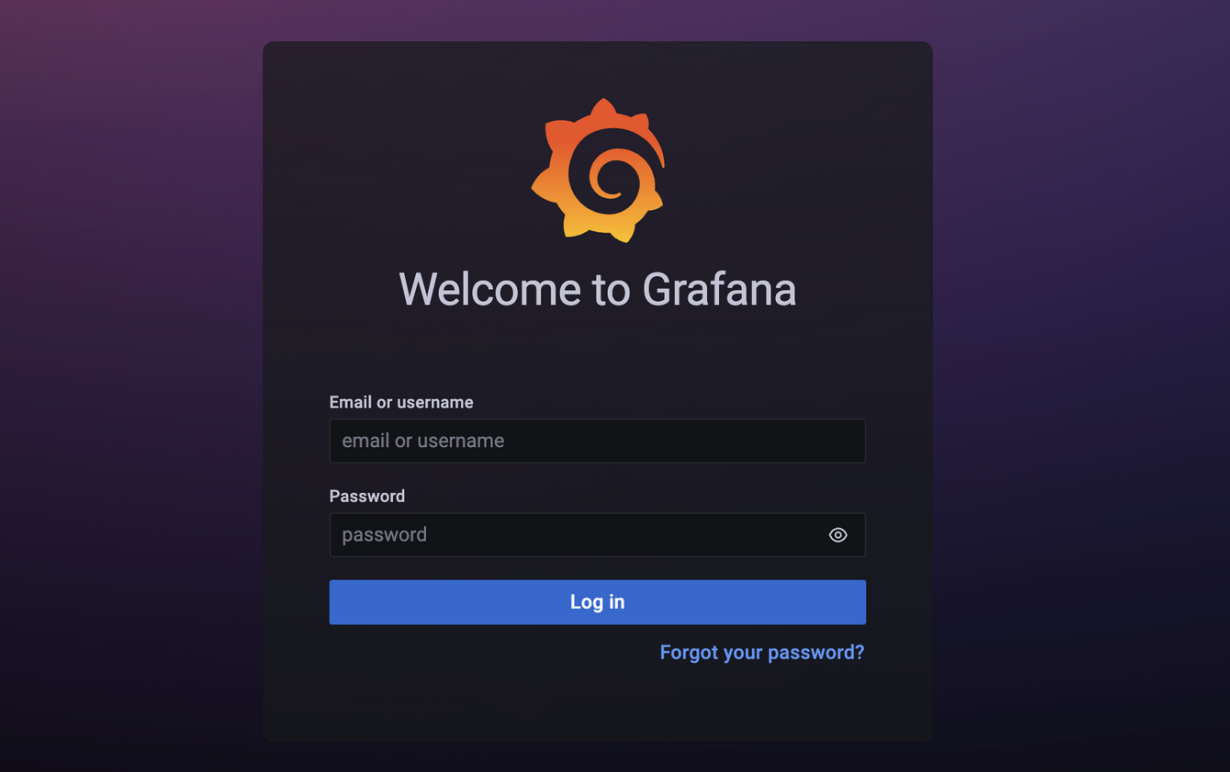
docker-compose up --build -d 이후 localhost:3000에 접속하면 Grafana 로그인 창이 표시됩니다.
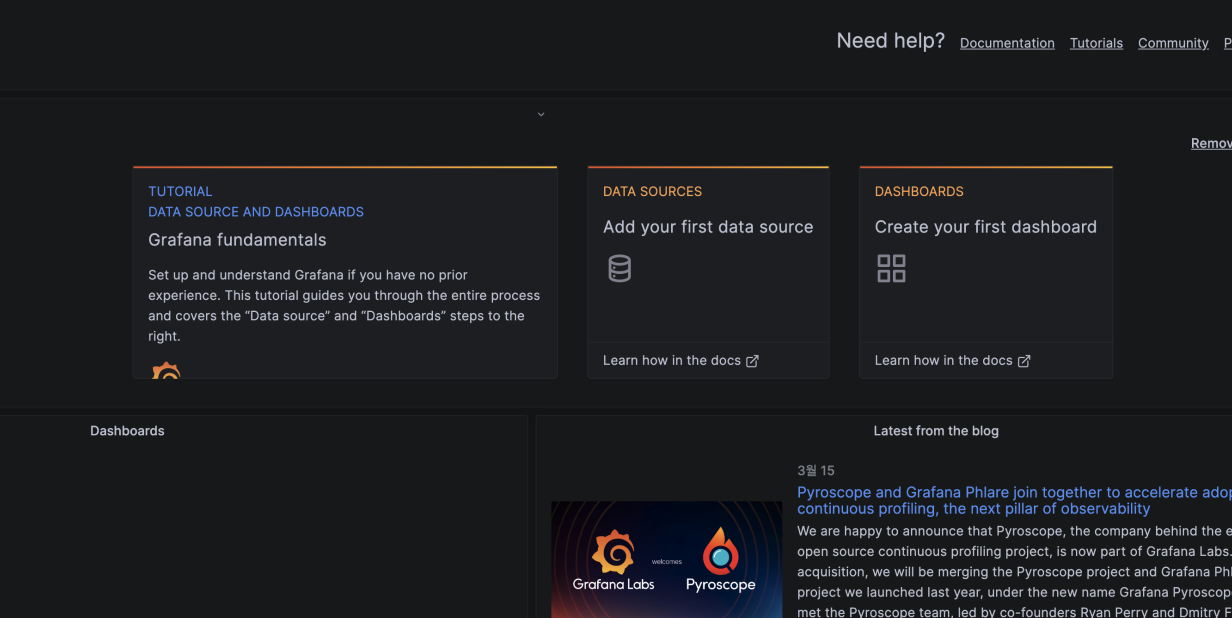
로그인이 완료되면 아래 Grafana 대시 보드에서 데이터 소스를 생성하는 메뉴로 들어갑니다.
이후 Prometheus를 선택하여 다음과 같이 연결 정보를 적어 줍니다.
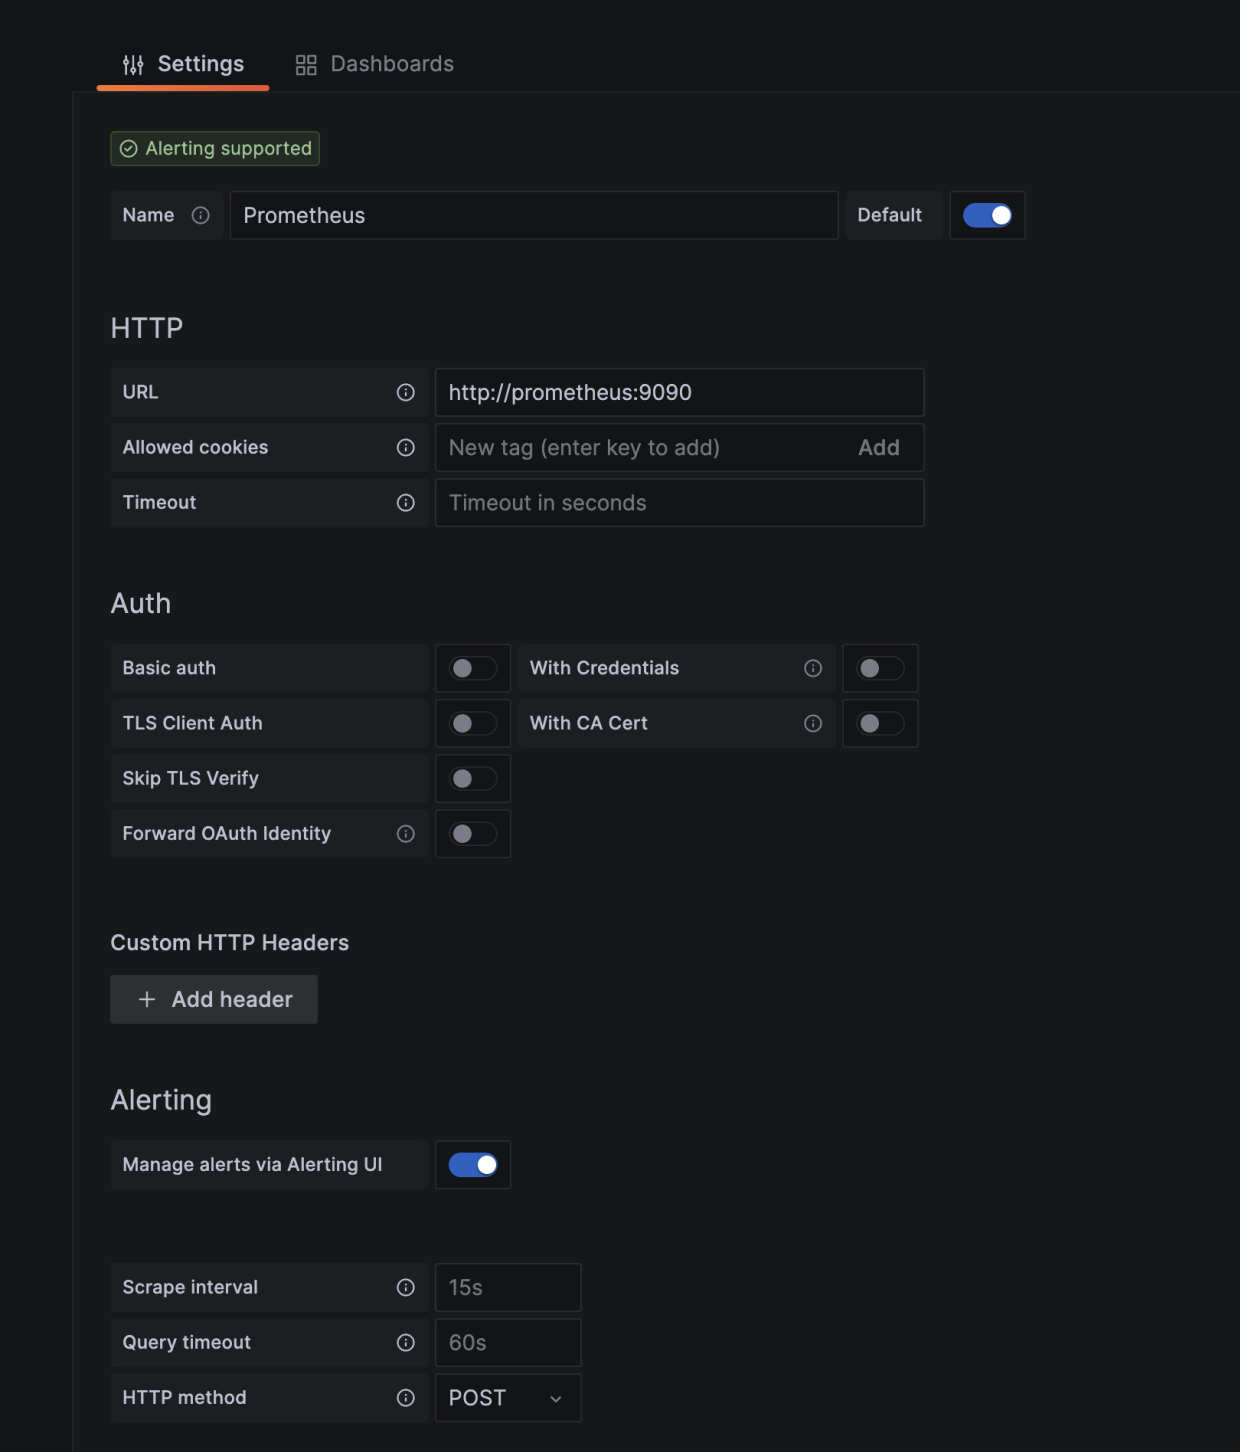
Grafana와 Prometheus 모두 도커 컨테이너 위에서 실행되고 있으므로 localhost가 아닌 컨테이너 이름인 prometheus로 적어주어야 합니다. 다음으로 시각화 할 대시 보드를 추가해야 합니다. 우리가 직접 커스터마이징할 수 있긴 하지만 귀찮으므로(?) 잘 만들어진 대시 보드를 훔쳐 옵니다. 아래 링크 중 원하는 대시 보드를 복사합니다.
- JVM MIcrometer: JVM (Micrometer) | Grafana Labs
JVM (Micrometer) | Grafana Labs
Thank you! Your message has been received!
grafana.com
- Spring Boot System Monitor: Spring Boot 2.1 System Monitor | Grafana Labs
Spring Boot 2.1 System Monitor | Grafana Labs
Thank you! Your message has been received!
grafana.com


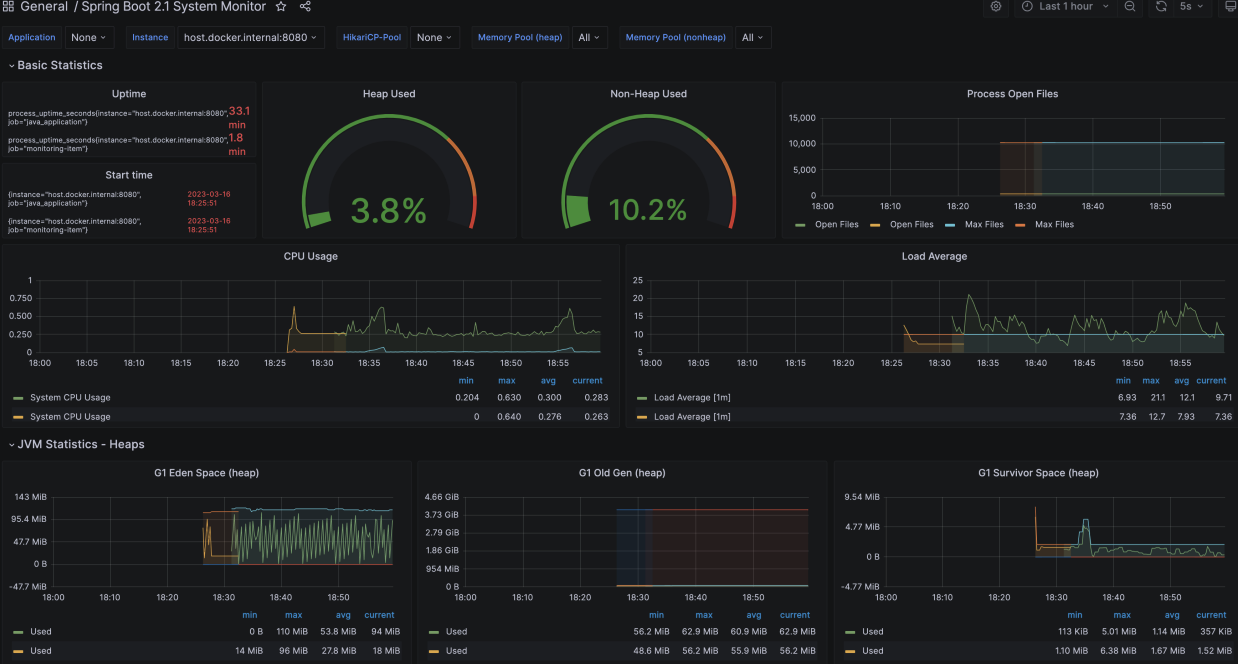
Import가 완료되면 다음과 같이 시각화 화면을 볼 수 있습니다.

부하 테스트를 실행하여 모니터링하기
조금 오래 부하 테스트를 하기 위해서 script.js를 수정해 주었습니다.
import grpc from 'k6/net/grpc';
import { check, sleep } from 'k6';

const client = new grpc.Client();
client.load(['../interface/channel/channel-interface/protobuf'], 'channel_service.proto');

export const options = {
  scenarios: {
    stress: {
      executor: "ramping-arrival-rate",
      preAllocatedVUs: 1000,
      timeUnit: "1s",
      stages: [
        { duration: "1m", target: 100 },
        { duration: "1m", target: 300 }
      ],
    },
  },
  noConnectionReuse: true
};

export default () => {
  client.connect('localhost:31400', {
    plaintext: false,
    timeout: '10s',
  });

  const data = { channel_id: 'channel-id-c4fad211-f583-460e-9302-d4a0e2922ea9' }
  const response = client.invoke('finance.chai.channel.ChannelService/GetChannel', data);

  check(response, {
    'status is OK': (r) => r && r.status === grpc.StatusOK,
  });

  console.log(JSON.stringify(response));
  client.close();
  sleep(1);
};
이제 k6 run script.js 명령어를 수행해 줍니다. 그리고 시간이 조금 흐른 뒤 Grafana 대시 보드에 가 보면 우리가 import한 대시 보드에 시계열 데이터가 이쁘게 담겨서 그래프로 표현해 주는 것을 보실 수 있습니다!
gRPC 메트릭을 모니터링할 방법은 없을까?
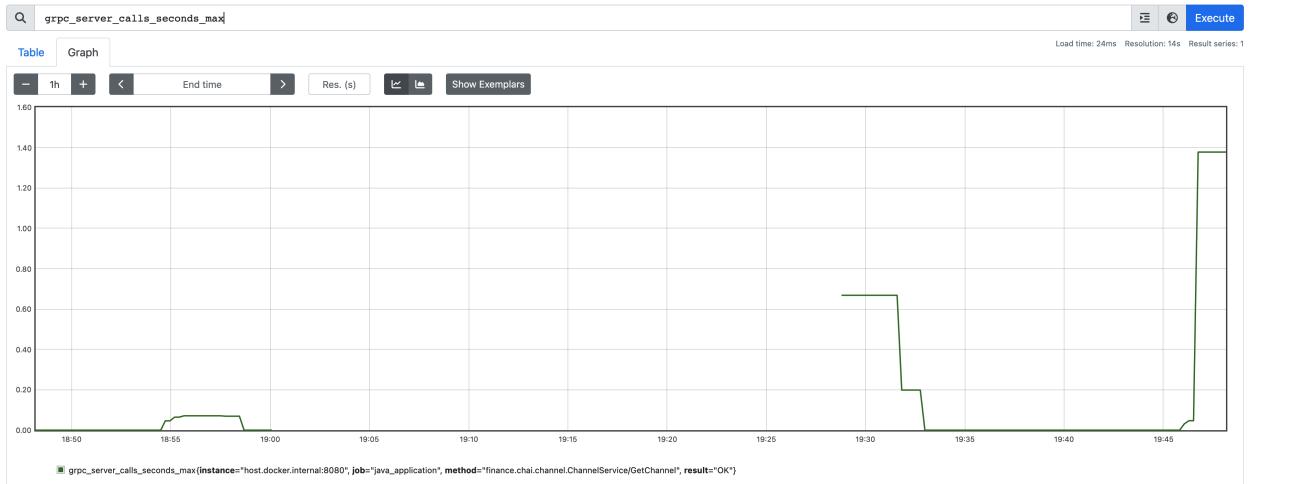
저희 Spring 서버는 grpc spring boot starter 라이브러리를 사용하고 있으므로 몇 가지 gRPC 관련 메트릭 데이터를 모을 수 있습니다. 다만, Grafana에 Spring gRPC를 이쁘게 시각화하는 대시 보드가 딱히 없어서 Prometheus 대시 보드에서 grpc_xxx 메트릭을 그래프로 검색하여 모니터링하시면 됩니다.
PostgreSQL 모니터링
Spring build.gradle에 아래 코드를 추가합니다.
implementation("io.prometheus:postgres_exporter")
postgres_exporter는 이 링크에서 자세한 내용을 확인하실 수 있는데, postgreSQL 서버의 메트 릭을 어딘가에 push하는 기능을 해 줍니다. postgreSQL 관련 docker-compose 파일을 아래와 같이 작성합니다.
version: '3'
services:
  cns-postgres:
    image: postgres
    container_name: cns-postgres
    ports:
      - "25432:5432"
    environment:
      - POSTGRES_USER=postgres
      - POSTGRES_PASSWORD=postgres
      - POSTGRES_DB=port
    volumes:
      - ./postgres/postgres.conf:/etc/postgresql/postgresql.conf
  postgres-exporter:
    image: wrouesnel/postgres_exporter
    container_name: postgres-exporter
    ports:
      - "9187:9187"
    environment:
      - DATA_SOURCE_NAME=postgresql://postgres:postgres@cns-postgres:5432/port?sslmode=disable
    depends_on:
      - cns-postgres
마지막으로 prometheus.yml을 수정합니다.
global:
  scrape_interval: 15s
  evaluation_interval: 15s

scrape_configs:
  - job_name: "prometheus"
    static_configs:
      - targets: ["localhost:9090"]

  - job_name: "java_application"
    metrics_path: '/actuator/prometheus'
    scrape_interval: 5s
    static_configs:
      - targets: ["host.docker.internal:8080"]

  - job_name: 'pgexporter'
    static_configs:
      - targets: ["host.docker.internal:9187"]
결과적으로 postgres exporter가 postgreSQL 서버로부터 메트릭을 가져오고, 이를 prometheus에 push하는 방식으로 동작합니다. grafana에서는 이 링크를 대시보드에 import하면 다음과 같이 postgreSQL 서버를 모니터링할 수 있습니다!

'개발 이야기 > 인프라' 카테고리의 다른 글
| Spring, MySQL 모니터링 & 성능 테스트 가이드 with Rest API (1) | 2024.05.19 |
|---|---|
| [K6] K6 세팅 가이드 with gRPC (0) | 2023.03.17 |
| [AWS에 Spring 초간단 배포하기] Nginx, Let's Encrypt를 사용한 HTTPS 설정 (0) | 2022.05.01 |
| [AWS에 Spring 초간단 배포하기] DNS 설정 (0) | 2022.04.30 |
| [AWS에 Spring 초간단 배포하기] SSH 접속 및 Spring 배포 (0) | 2022.04.30 |


댓글